Satellite radar maps land subsidence in 465 cities with over one million people, 2014–2023
Researchers used Sentinel-1 radar data to build consistent subsidence maps for 465 cities worldwide, enabling comparison of hotspots and trends across regions.
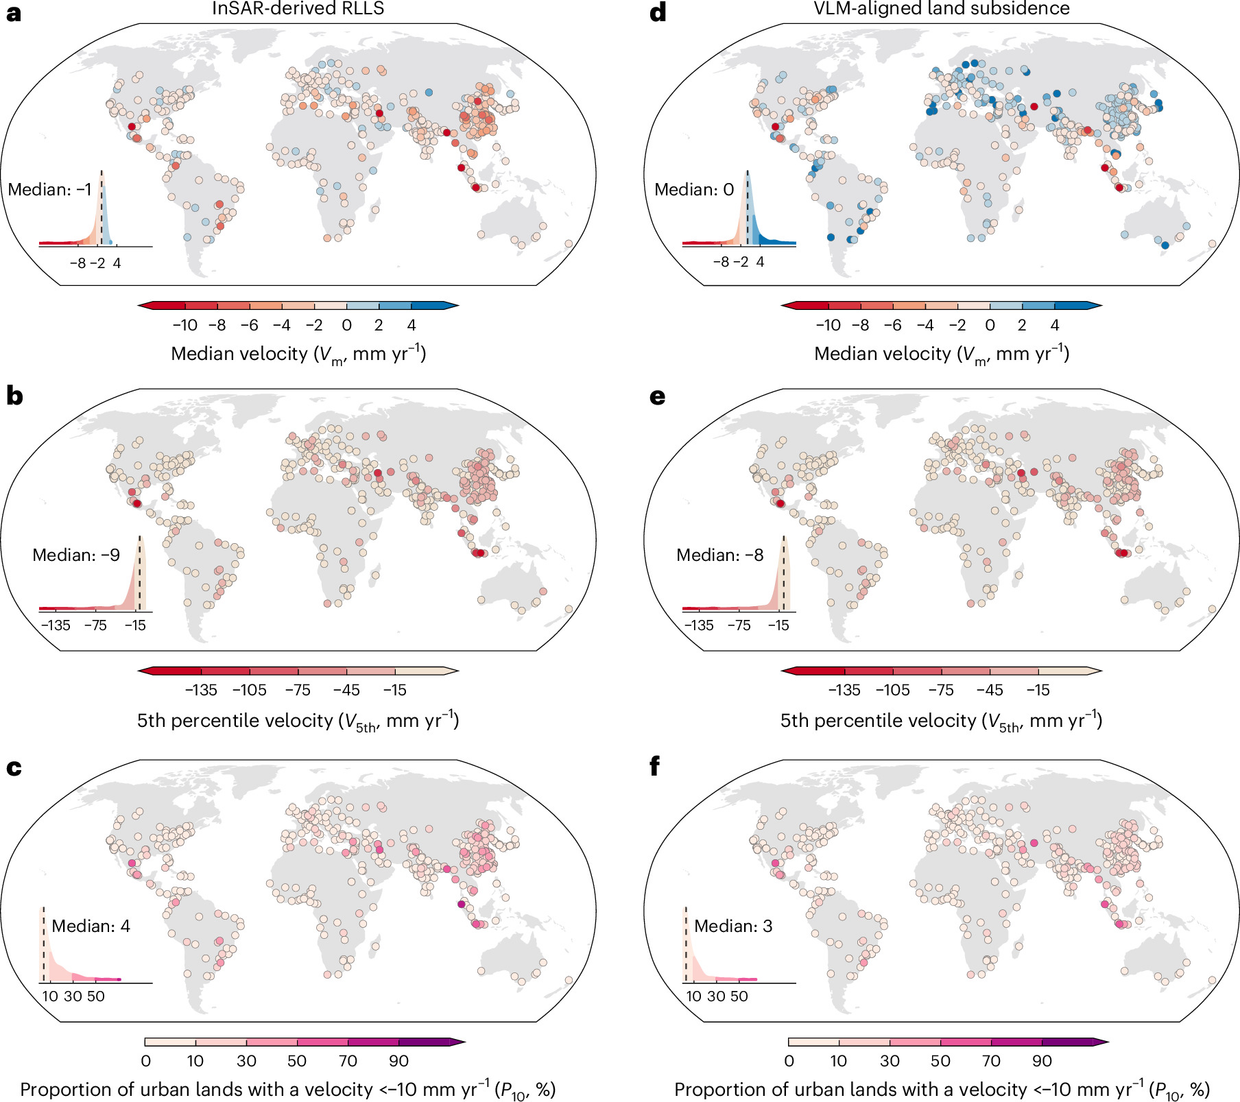
Researchers have produced high-resolution maps of relative local land subsidence for 465 cities worldwide with populations above one million, according to a paper on nature.com. nature.com
nature.comnature.comOpen source ↗ The maps are based on satellite interferometric synthetic aperture radar (InSAR) data for 2014–2023.
nature.com
nature.comnature.comOpen source ↗ The authors note that a global assessment of urban subsidence with a consistent methodology had been lacking, which limited targeted adaptation and mitigation.
nature.com
nature.comnature.comOpen source ↗
Where subsidence is strongest
According to the authors, subsidence is most severe in Southeast Asia, West–Central Asia and North America. nature.com
nature.comnature.comOpen source ↗ It is also evident in historically under-studied regions, including South America, Africa and Russia.
nature.com
nature.comnature.comOpen source ↗
The team also referenced the relative local subsidence to a global vertical land motion (VLM) product. The spatial patterns remained broadly consistent after this step, although the VLM correction adds uncertainty, the authors report. nature.com
nature.comnature.comOpen source ↗
Trends and open data
The study detected marked deceleration of subsidence in many cities in Southeast and East Asia. At the same time, substantial urban areas in these regions continue to show accelerating subsidence. nature.com
nature.comnature.comOpen source ↗
The work uses Sentinel-1 SAR images, which are publicly available. GNSS and VLM data were taken from the Nevada Geodetic Laboratory. nature.com
nature.comnature.comOpen source ↗ Subsidence velocities, InSAR coherence, the standard deviation of velocities and the locations of reference points for all 465 cities can be viewed in the GUS (Global Urban Subsidence) application on Google Earth Engine. The subsidence maps, both relative local and aligned to the global VLM product, are available for download, as are the Python and Matlab codes used to calculate subsidence from SAR images.
nature.com
nature.comnature.comOpen source ↗
The authors state that the global maps and trend estimates provide a consistent basis for identifying hotspots and prioritizing actions to reduce subsidence-related hazards. nature.com
nature.comnature.comOpen source ↗