Retrospective study of 308 patients: fat attenuation index on coronary CT linked to high-risk plaque
In a single-center retrospective cohort, higher fat attenuation index on coronary CT angiography accompanied high-risk plaque features; adding it raised model AUC from 0.755 to 0.828.
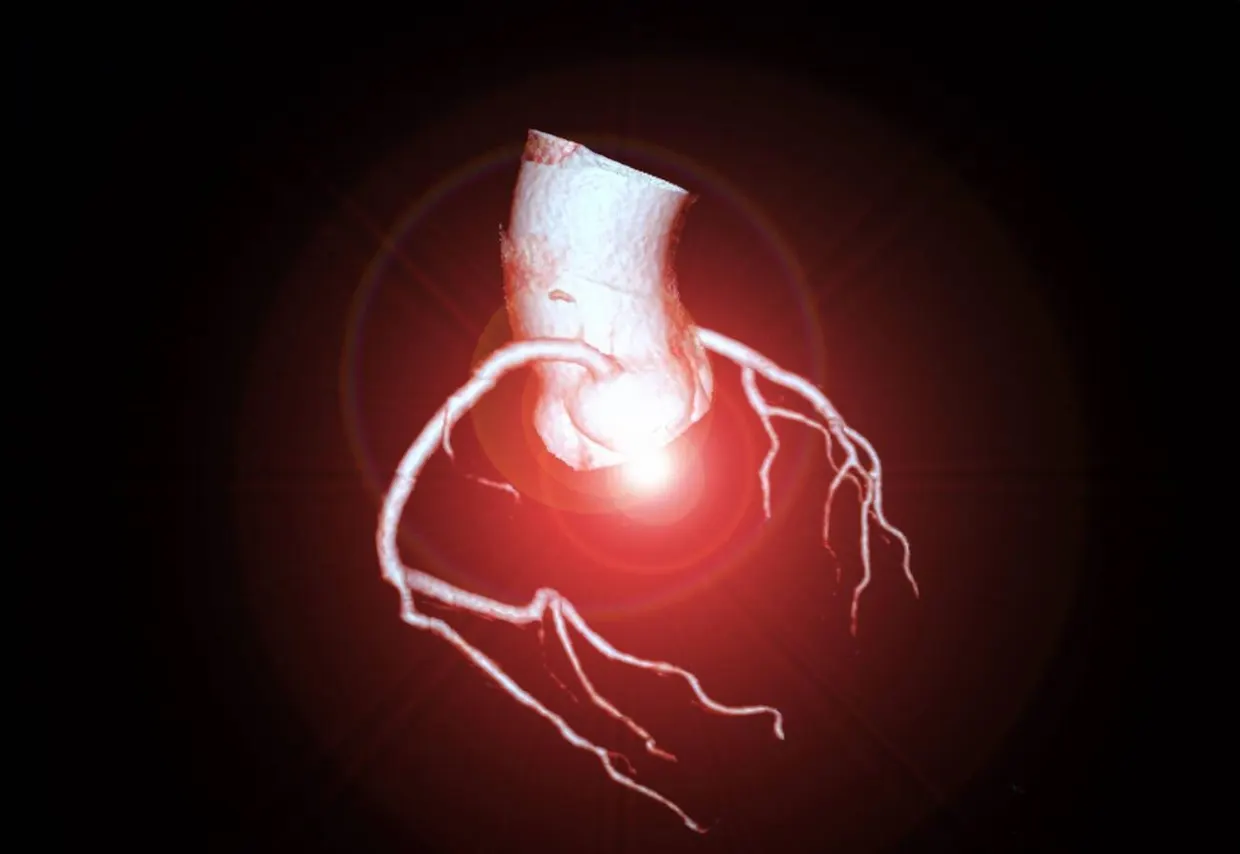
A retrospective single-center study published in BMC Cardiovascular Disorders examined the link between the fat attenuation index (FAI) and high-risk coronary plaque (HRP) on coronary CT angiography (CCTA). Of 412 patients who underwent CCTA from October 2024 to April 2026, 308 were analyzed after exclusions. HRP was present in 190 patients and absent in 118 biomedcentral.com
BMC Cardiovascular Disordersbiomedcentral.comOpen source ↗.
HRP was defined as at least two of four features within the same plaque: low-attenuation plaque, positive remodeling, spotty calcification, or the napkin-ring sign. Clinical, laboratory, and imaging data were collected for each patient.
FAI and plaque features
FAI was higher in the HRP group: -77.22 ± 4.31 HU versus -83.01 ± 4.39 HU in the non-HRP group (t = 11.381, P < 0.001). FAI correlated moderately with HRP (r = 0.534, P < 0.001), and most strongly with positive remodeling (r = 0.450).
LASSO logistic regression retained nine predictors, including FAI. In the multivariable model, each 1-HU increase in FAI was associated with 33.4% higher odds of HRP (OR = 1.334, 95% CI 1.221–1.458, P < 0.001) biomedcentral.com
BMC Cardiovascular Disordersbiomedcentral.comOpen source ↗.
Prediction models
The authors compared four algorithms using five-fold stratified cross-validation. Pooled out-of-fold AUC was 0.828 for logistic regression, 0.813 for XGBoost, 0.801 for random forest, and 0.796 for SVM. Logistic regression was significantly better than random forest and SVM but not XGBoost (DeLong P = 0.313). The mean fold AUC was 0.829 ± 0.072.
A model without FAI reached an AUC of 0.755; adding FAI raised it to 0.828, a difference of 0.073 (95% CI 0.030–0.115, DeLong P = 0.0009). Decision curve analysis showed higher net benefit across threshold probabilities of approximately 11%–91%.
Calibration was imperfect. The intercept was 0.045 and the slope 0.810; the Hosmer-Lemeshow statistic indicated some miscalibration (χ² = 16.227, P = 0.039), with the curve deviating from the diagonal at intermediate predicted probabilities biomedcentral.com
BMC Cardiovascular Disordersbiomedcentral.comOpen source ↗.
The authors note that HRP and FAI were assessed on the same CCTA examination. The findings therefore do not establish future cardiovascular risk, treatment benefit, or causality, and longitudinal validation is needed.