Utrecht University model: groundwater recovers fast after drought at 57% of locations, 26% unstable
A global simulation for 1960–2019 sorted land by groundwater recovery after drought: 57% resilient, 15% vulnerable, 26% unstable, where repeated droughts cut recovery capacity.
A team led by hydrologist Sandra Hauswirth at Utrecht University (Netherlands) has published the first global study of groundwater drought recovery in Environmental Research Water. It is based on high-resolution simulations of a global groundwater model iop.org
Environmental Research Wateriop.orgOpen source ↗. The results come from the model, not from direct measurements.
The model divides land into cells of about 1 km and calculates the water table month by month from 1960 to 2019. It accounts for both water infiltrating the soil and water pumped out. Against real wells, it gave useful estimates at about 80% of wells shallower than 60 m and about 70% of deeper ones.
A drought began when groundwater fell so far below its usual level for that time of year that only about 16% of months would qualify. It ended when the level rose back above that line. Droughts of two months or less were excluded, because monthly data cannot capture them reliably.
Four recovery regimes
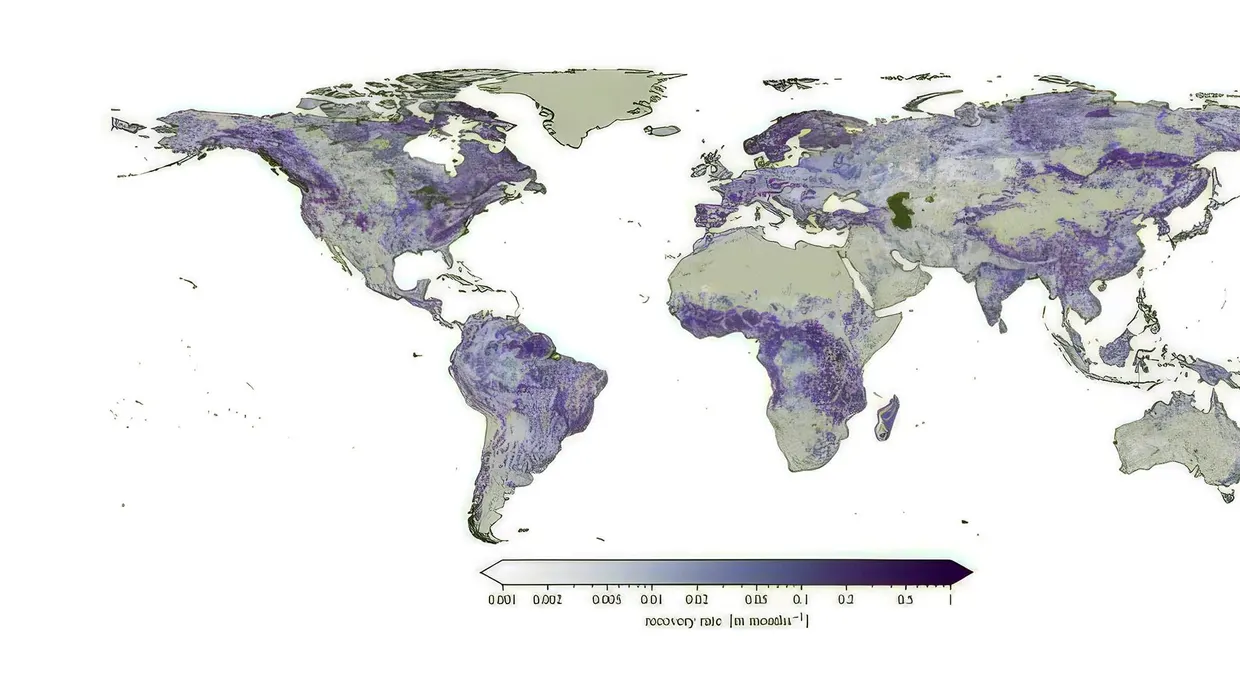
The authors classified locations by event-specific recovery rates into resilient, stable, vulnerable and unstable regimes iop.org
Environmental Research Wateriop.orgOpen source ↗. Resilient locations, the majority at 57%, recover rapidly and robustly after droughts. Vulnerable locations (15%) are shaped by geophysical constraints and heightened climate variability. There, water fell quickly and rose back slowly, and in every region examined closely they lay at higher elevations. Stable locations make up about 2%.
Unstable regions cover 26%. They are characterised by frequent, successive droughts that reduce recovery capacity. Their droughts were shorter and milder than in other groups, and they were not limited to heavily pumped areas. Locations with similar average recovery rates can differ in regime and in controlling drivers.
What sets the pace
Local climate has the largest influence on the spatial variability of recovery rate. Humid regions such as the Amazon and Southeast Asia recovered quickly. Dry regions recovered slowly, including Australia, the Middle East, Central Asia, southern Africa, southern South America and the US Midwest. At a typical location the water table rose about 1.8 cm per month during recovery, and in the fastest places up to about 1 m per month. Topography and aquifer storage capacity account for regional differences.
The authors note limitations. They filtered out places where water tables have fallen steadily for decades, so such areas may be underrepresented. Because 60 years were averaged, the results do not show whether recovery is speeding up or slowing down. According to the authors, regional climatic, geophysical and anthropogenic factors should be integrated into groundwater management.